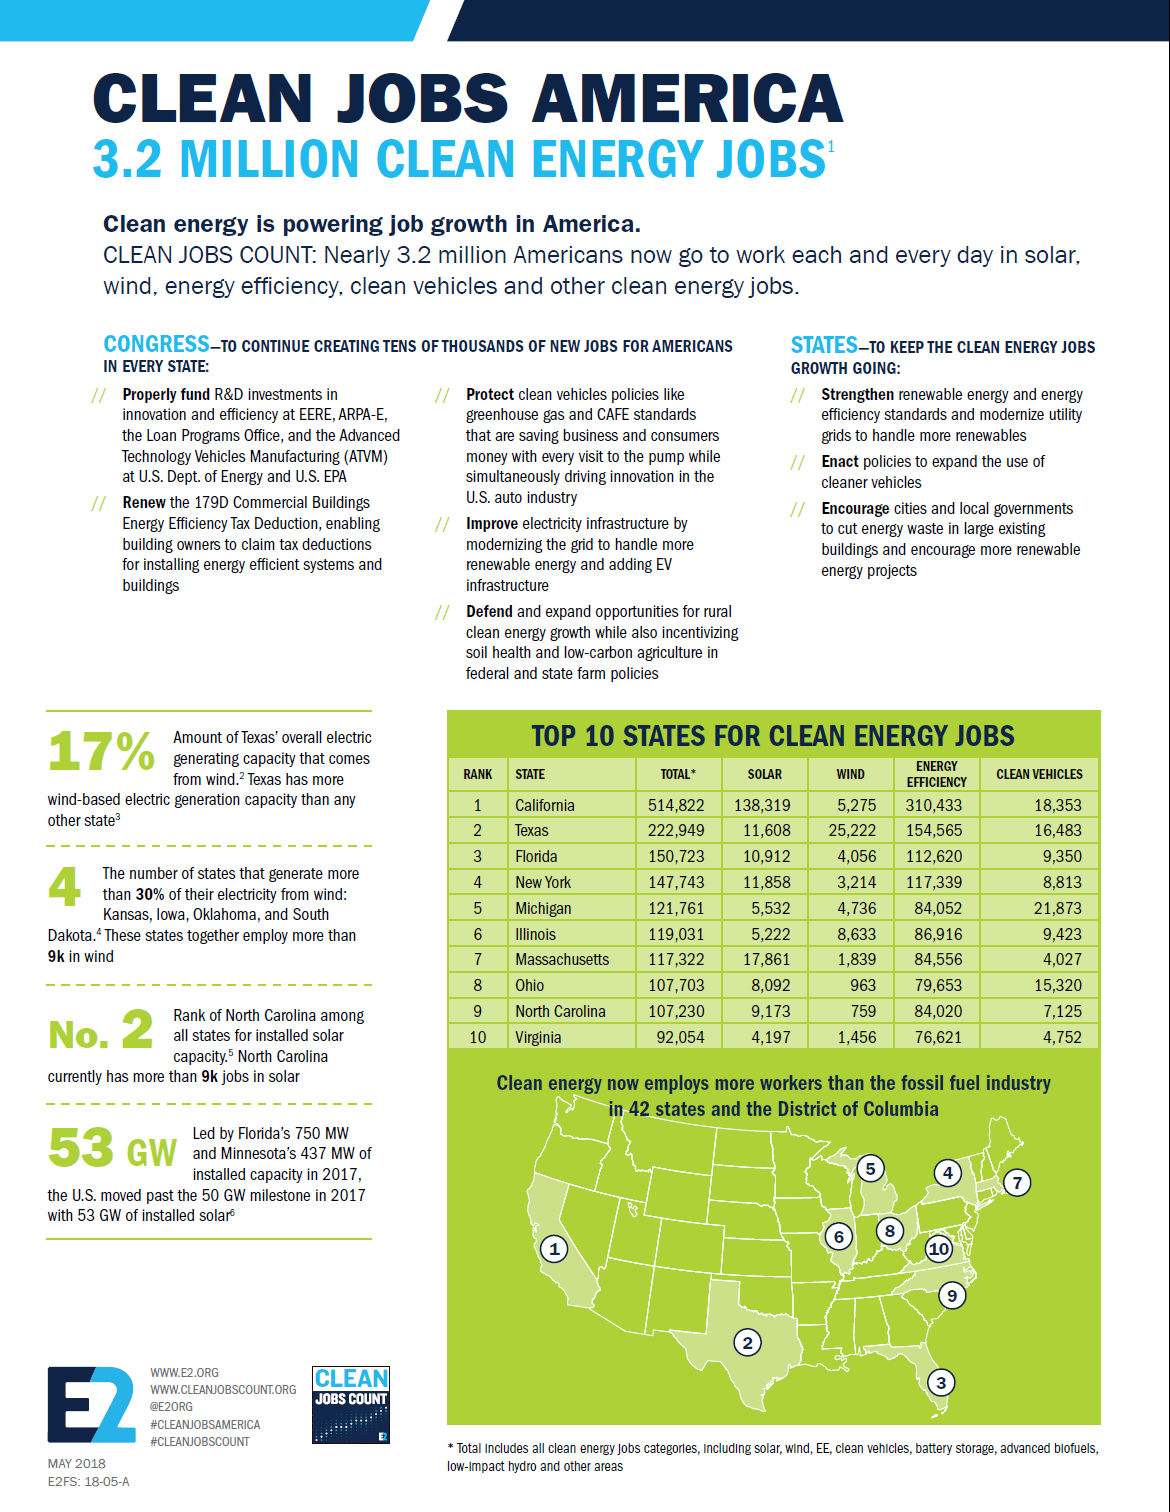
*This jobs data comes from the US Energy Employment Report (USEER) spearheaded by the National Association of State Energy Officials (NASEO), Energy Futures Initiative, E2 and others. It builds on the Department of Energy’s now-cancelled USEERs and also on past and ongoing clean jobs research by E2 and its partners, including 2016 Energy Efficiency Jobs in America report, Clean Jobs America 2017 report, Clean Jobs Rural America 2018 and the 2018 Clean Jobs Midwest report the past three years running.
Our interactive clean energy jobs map and industry chart breakdowns are now live. Click the below links or use the dropdown selection under Impact in the navigation bar.
Every day across every state, country, metro area, and district, millions of Americans go to work building the clean energy economy. These industries –from energy efficiency and renewables to clean vehicles and the smart gird — now employ seven times more Americans than fossil fuels.
- See how these jobs extend across America through our interactive ACROSS THE COUNTRY map.
From New York and North Carolina to Illinois and California, states with the best clean energy policies now have the most clean energy jobs.
- Learn how your state’s clean energy jobs breakdown by industry and compare to neighboring states through our clickable and slice-able IN YOUR STATE charts.
The clean energy industry is under attack. Some federal and state lawmakers are slashing support for solar, wind, energy efficiency and electric vehicles, while simultaneously giving away new tax breaks, opening up our seashores and national parks and rolling back environmental protections just to prop up coal and petroleum companies.
- Explore how clean energy jobs in America breakdown by technologies — such as solar and smartgrid — and across the supply chain through trade, construction and manufacturing using our our clickable and slice-able IN YOUR INDUSTRY charts.
